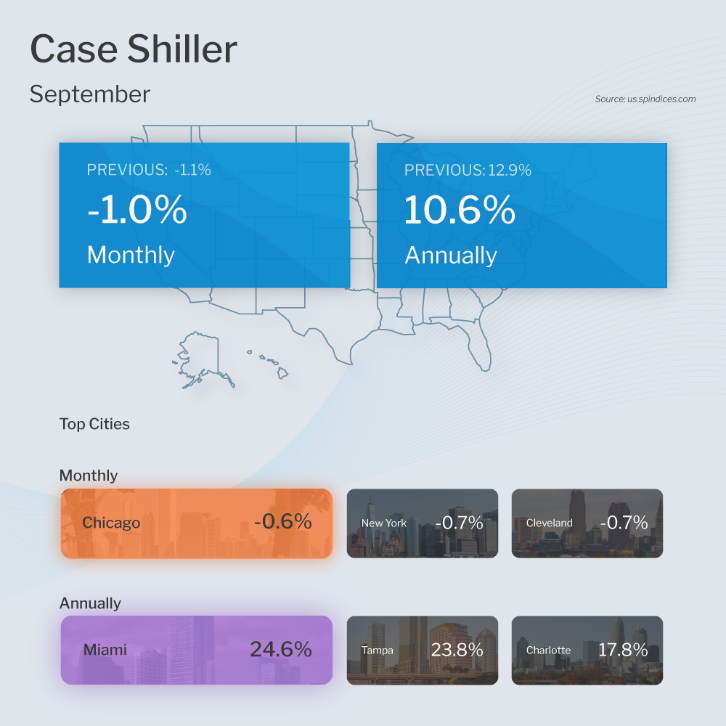
The Case-Shiller Home Price Index, which is considered the “gold standard” for appreciation, showed home prices fell 1% in September but they were 10.6% higher when compared to September of last year. This annual reading is a decline from the 12.9% gain reported in August but still strong.
The Federal Housing Finance Agency (FHFA) also released their House Price Index. This report measures home price appreciation on single-family homes with conforming loan amounts, which means it most likely represents lower-priced homes. Home prices rose 0.1% from August to September and they were up 11% from September of last year. This is a decline from the 11.9% annual increase reported in August, but again still solid on an annual basis.
What’s the bottom line? Case-Shiller’s 10-city and 20-city Indexes were down 1.4% and 1.5% respectively, meaning that a lot of the losses were concentrated in the bigger cities that were somewhat overheated, including Seattle (-2.9%), San Francisco (-2.9), San Diego (-2.1%), Denver (-2.0%) and Los Angeles (-1.8%). Note that the decreases were milder than the previous report.
Further softness in home prices is possible in the next several Case-Shiller reports as the full impact of peak rates was not realized in September. And while home prices are now down 2.5% from their peak, this is a far cry from a housing crash of 20% that some in the media are predicting.